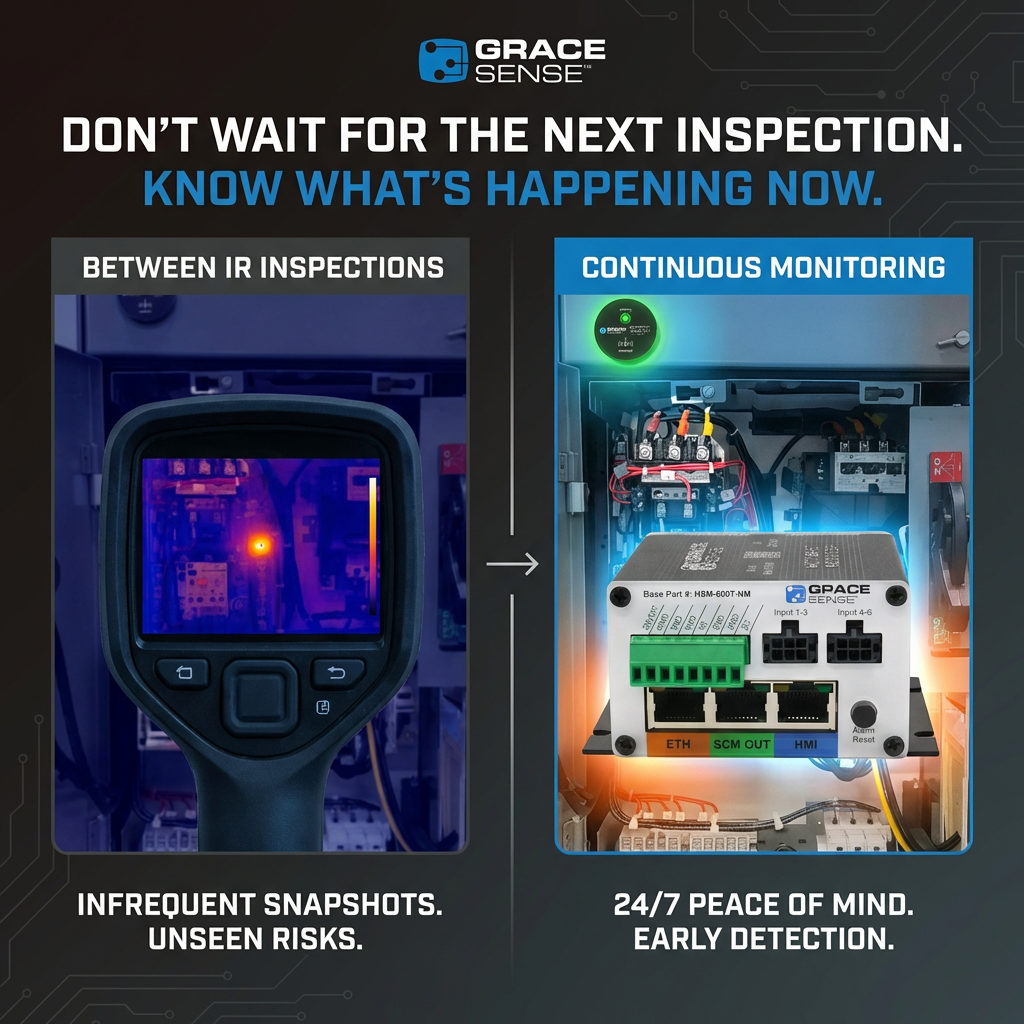
Picture this: it’s been 4 months since your last IR scan, and the report from the scan came back normal. But suddenly, a piece of key equipment fails catastrophically; in the time since that last scan, it’s been developing issues unseen, and now your facility is in crisis mode trying to get it fixed.
Many plant managers have long been relying on IR thermography alone for thermal monitoring of their equipment. And while that solution may seem “good enough,” when an issue arises between scans, you might start wondering if there’s a better way.
This is where Continuous Thermal Monitoring (CTM) comes in. It allows you to monitor specific, high-risk connection points 24/7/365. In combination with IR Thermography, it can reduce downtime, improve safety, and even save your facility money in the long run.
Here’s what changes when you add CTM to your IR program.
Why the Right Choice Matters
An electrical failure in key equipment can bring production to a complete halt. That means spending money on repairs, and losing even more money from lost production.
One of the main causes of these electrical failures are thermal issues. But IR Thermography only gives you a snapshot for one day of your facility. If a thermal issue is building between inspections, your equipment could fail without you ever having a chance to prevent it.
With CTM, you know how hot critical equipment is getting, no matter the day or the time. This lets you take action ASAP, preventing costly downtime.
How We Evaluated the Two Approaches
There are many comparisons to be made between CTM and IR Thermography. But the conversation isn’t really “either/or”; nobody’s telling you to get rid of IR scans.
Instead, the conversation is about how adding CTM to the mix impacts your operations. In other words, how it changes thermal monitoring for maintenance staff.
To find out more, I evaluated two approaches: with, and without CTM.
For each, I looked at detection and visibility: how often temperature is measured, how quickly problems are detected, and how long before your team is alerted. I also evaluated safety exposure, including arc flash risk and the hazards that come with working around energized equipment.
From there, I looked at the cost and compliance implications: downtime risk, inspection frequency, labor, and how each approach holds up against NFPA 70B. Finally, I compared the technical specs of each: integration capabilities, scalability, and how data is stored and accessed.
The goal: understand how continuous monitoring between IR inspections changes your facility's risk profile and your bottom line.
Side-by-Side Comparison Table
|
Attribute |
IR Thermography |
CTM |
|
DETECTION & VISIBILITY |
||
|
Data Frequency |
Snapshots on inspection days only |
Continuous monitoring between and during IR scans |
|
Visibility Between Inspections |
No visibility (gaps between every scan) |
No gaps; always monitoring |
|
Detection Timing |
Issues found only during scheduled scans |
Early detection in real time |
|
Alarm Capability |
None; findings reviewed post-inspection |
Configurable thresholds + latching alarms |
|
Trend Analysis |
Manual comparison of past inspection records |
ΔT trending over ambient for early fault detection |
|
SAFETY |
||
|
Arc Flash / Energized Work Exposure |
Required for each inspection cycle |
Fewer required inspections reduce time in front of live equipment |
|
Phase Imbalance Insight |
Limited visual interpretation during scans |
Phase differential monitoring built in, flagged automatically |
|
Dew Point / Condensation Risk |
Not monitored between inspections |
Integrated dew point alarming year-round |
|
COST & COMPLIANCE |
||
|
Unplanned Downtime Risk |
High — failures can develop unseen between scans |
Significantly reduced with early fault detection |
|
IR Inspection Frequency |
Fixed schedule regardless of asset condition |
CTM data supports condition-based intervals, potentially reducing scan frequency |
|
Insurance / Risk Profile |
Standard — limited documentation between inspections |
Continuous monitoring logs may support risk reduction conversations with insurers |
|
Labor Requirement |
IR Technician required for every data point |
Automated monitoring reduces manual inspection burden |
|
Compliance Support |
Supports time-based PM schedules |
Supports NFPA 70B condition-based maintenance |
|
TECHNICAL SPECS |
||
|
Monitoring Type |
Surface temperature imaging during inspection |
Direct conductor/bus ΔT monitoring vs. ambient, continuously |
|
Integration |
Standalone inspection tool |
PLC/SCADA integration via Modbus TCP/IP & EtherNet/IP |
|
Scalability |
One asset per scan pass |
Up to 78 monitored points per network module |
|
Data Ownership |
Manual records from each inspection |
Continuous stored data, always trend-ready |
|
Installation |
No permanent installation |
Compact modules, DIN or surface mount |
Detection & Visibility
IR Thermography is a single day snapshot of your facility. It’s comprehensive, but that’s all the data you’re going to get until the next scan, months from now. And, it can be difficult to do trend analysis with periodic IR thermography alone.
CTM fills this gap by constantly monitoring temperature before, during, and after scans, meaning there’s no blind spots in your data. When temperatures go beyond your set threshold, the right people are notified the moment conditions shift.
Plus, with CTM, you have automatic trend tracking and analysis, tracking ΔT over ambient continuously. When you have an IR scan done, that trend history will let you see exactly how current conditions compare to the equipment’s established baseline
Safety
Every IR inspection means a technician standing in front of live equipment, creating risk of arc flashes and other incidents. And, IR scans can only catch phase imbalances if they happen during the scan, and can’t catch condensation risks at all.
CTM reduces how often that exposure is necessary by allowing you to do less frequent scans and monitor equipment temperatures without opening panels. And, it includes automatic dew point and phase imbalance alarms.
Cost & Compliance
IR requires a trained technician for every data point, with scheduling, travel, and reporting overhead each time.
CTM reduces that burden considerably, and its continuous data logs support NFPA 70B condition-based maintenance requirements rather than just time-based PM schedules.
CTM data also supports condition-based IR scheduling — thermographers deployed when asset health warrants it, not by default — which for many facilities means paying for fewer inspections without any reduction in coverage. That same documentation record may support risk reduction conversations with insurers to lower rates.
Technical Specs
IR is a standalone tool, and the reports it creates require manual retrieval and comparison to learn anything.
CTM integrates directly with PLC/SCADA systems via Modbus TCP/IP and EtherNet/IP, feeding continuous data into existing platforms. A single network module monitors up to 78 points, making facility-wide coverage practical in a way that inspection routes can't match.
The result is a persistent data record that IR snapshots can be layered into, giving maintenance teams both the continuous signal and the detailed visual confirmation needed to act with confidence.
Why Add Continuous Thermal Monitoring
CTM strengthens your program when the cost of a gap is too high to accept. That's typically when:
- Unplanned downtime carries significant production or revenue consequences.
- Assets are critical, densely packed, or difficult to safely access for frequent scans.
- You want your team alerted to problems in hours, not at the next scheduled inspection.
- You're moving toward predictive maintenance and want data to support that shift.
- Reducing arc flash exposure is a priority.
- You want to extend IR inspection intervals without increasing risk.
If any of these apply to your facility, and you’re relying on IR thermography alone, the time is now, not later, to have a discussion about adding CTM to your key equipment.
Conclusion
For most facilities, the question isn't whether to keep running IR scans, but whether the gaps between them are acceptable for your most critical assets.
CTM doesn't replace IR thermography. It covers what IR can't: the hours, days, and weeks between inspections when conditions can shift and no one is watching. Together, they give maintenance teams both the continuous signal and the detailed visual confirmation needed to act with confidence.
For facilities serious about condition-based maintenance, the two tools are more useful together than either is alone.
If you’re starting to evaluate where continuous monitoring fits into your program, seeing it in action makes a big difference. Learn more about Grace Technologies Continuous Thermal Monitoring Solutions here!
The HSM 600 provides continuous thermal monitoring for low-voltage equipment, helping teams catch developing issues earlier and reduce risk between inspections.

To safer, smarter operations,