Cooling towers lose capacity when changes in fill, airflow, fan controls, water distribution, mechanical components, or water treatment reduce their ability to reject heat. The challenge is that standard plant data can show that cooling performance has changed without revealing why. Understanding thermal performance requires looking at operating conditions together, including wet-bulb temperature, water flow, airflow, and fan power.
Do you produce more in winter than you do in summer? If the answer is yes, your cooling system may be part of the bottleneck.
Many facilities already know that production falls as outdoor conditions get hotter. What they often don't know is why. A cooling tower can still deliver cold water, its fans can still be running, and nothing may look obviously wrong while lost thermal capacity quietly limits production in summer or drives unnecessary fan energy use during cooler months.
Why Does Cooling Tower Efficiency Matter Year-Round?
During hot weather, a tower that has lost heat-rejection capability may struggle to maintain the cold-water temperature the process requires. Depending on the facility, that can affect a steam condenser at a power plant, a bottle-cooling process in food and beverage, or another heat-sensitive part of production.
Winter can hide the same problem. A cooling tower may still reach its setpoint in cooler weather, but if its fans and pumps have to work harder to get there, the facility may be using more energy than necessary. For large field-erected towers, replacement can also be a multi-year undertaking, making it especially valuable to understand whether existing capacity can be recovered before considering a major capital project.
How Do You Calculate Cooling Tower Efficiency?
Cooling tower efficiency is commonly calculated using the tower's range and approach:
Cooling Tower Efficiency (%) = Range ÷ (Range + Approach) × 100
Range is the difference between the hot-water temperature entering the cooling tower and the cold-water temperature leaving it. Approach is the difference between the cold-water temperature leaving the tower and the ambient wet-bulb temperature.
For example, suppose water enters a cooling tower at 100°F and leaves at 80°F while the ambient wet-bulb temperature is 70°F:
Range = 100°F − 80°F = 20°F
Approach = 80°F − 70°F = 10°F
Efficiency = 20 ÷ (20 + 10) × 100 = 66.7%
Wet-bulb temperature matters because it represents the practical limit for evaporative cooling under current atmospheric conditions. However, a single efficiency calculation is still only a snapshot. Trending thermal performance against changes in weather, load, airflow, water flow, and design expectations provides a much clearer picture of how tower performance changes over time.
What Are the Warning Signs Your Cooling Tower Is Losing Capacity?
Cooling tower degradation does not always announce itself with an obvious failure. Approach temperature may begin rising under comparable wet-bulb and load conditions, or range may shrink compared with design expectations. Fans may operate at higher speeds or draw more power to maintain the same cold-water temperature.
Operational changes can provide clues too. Summer derating or line slowdowns that were not needed in previous years deserve attention, as do physical signs such as basin sediment, scale on the fill, or visibly uneven water distribution. The difficult part is determining which condition is actually responsible.
What Are the Hidden Causes of Lost Cooling Tower Capacity?
Several cooling tower performance problems can produce similar symptoms from the control room. That makes understanding the underlying cause more complicated than simply watching water temperature.
1. Is Your Cooling Tower Fill Degraded or Fouled?
Fill creates surface area for water and air to exchange heat. As it ages, becomes fouled, or accumulates scale, that heat-transfer capability can decline.
At an Arizona food and beverage facility discussed during Grace Technologies cooling tower webinar, degraded fill was ultimately identified as the primary source of lost performance after a fan-control issue had first been addressed. The facility had been considering adding another cooling tower, illustrating why finding the actual source of lost capacity matters before committing to additional equipment.
2. Can Your Fan Motor Look Healthy While Airflow Is Still Low?
Yes. Bearings and vibration can appear normal while the fan moves less air than it should. Blocked louvers, plugged drift eliminators, incorrect blade pitch, or other restrictions can reduce airflow without producing an obvious motor problem.
At a 620 MW combined-cycle power plant in the Midwest, an airflow issue was identified even though vibration monitoring indicated healthy equipment. After the site's improvements, the approved project results included more than $500,000 in annual profit increase and more than 4 million gallons of water saved annually.
For more on the mechanical side of monitoring, read What Is a Continuous Vibration Monitor?
3. Are Unstable Fan Controls Costing You Efficiency?
A fan does not have to completely fail to create a performance problem. Large swings in fan speed can reduce operating efficiency and accelerate wear on rotating equipment.
At an industrial chiller facility, repeated motor and gearbox failures were traced to unstable fan controls causing hot starts. The issue was addressed through fan staging, and the approved project result was a $100,000 reduction in maintenance costs.
4. Is Water Actually Being Distributed Evenly?
Cooling towers depend on both airflow and water distribution. Clogged spray nozzles, uneven flow between cells, or water flow outside design conditions can drag down overall tower performance.
An acceptable overall flow reading therefore does not necessarily mean water is being distributed correctly where heat transfer occurs. Looking at performance across the tower can help teams determine where further inspection is needed.
5. Could a VFD or Controls Fault Be Hiding in Plain Sight?
Sometimes equipment appears to be following normal commands when the control system itself is part of the problem. A fan running at low speed can look intentional when a VFD or hardware fault is actually preventing expected operation.
Comparing fan behavior with the tower's thermal response provides additional context that fan speed alone cannot.
6. Could Belt Slippage Be Reducing Airflow?
A slipping belt can allow the motor to continue operating while less mechanical power reaches the fan. Looking at motor power and airflow data together can reveal a mismatch that may be difficult to identify from either measurement alone.
This is where different monitoring technologies can complement one another. Machine health monitoring can provide insight into rotating equipment condition, while thermal performance monitoring evaluates whether the cooling tower is effectively rejecting heat.
7. Can Water Treatment Affect Cooling Tower Performance?
Water treatment is essential, but changes within a treatment program can also affect performance elsewhere in the cooling system. In one example from the webinar, a water-treatment change affected efficiency in a downstream heat exchanger, specifically the steam condenser.
Recirculation is another commonly suspected culprit, but it should not automatically be assumed to be the cause. Sometimes the operating data points somewhere else entirely.
Why Can't Standard Plant Data Tell You Which Problem You Have?
Most facilities already collect useful information such as water temperatures, heat load, and wet-bulb conditions. Those measurements can show that performance has changed, but they may not provide enough information to isolate the cause.
In one example from the cooling tower webinar, operating data from two towers looked nearly identical even though one had lost more than 25% of its efficiency.
| Standard Plant Data | Performance Monitoring Adds |
|---|---|
| Hot and cold water temperatures | Performance trends under changing operating conditions |
| Wet-bulb conditions | Changes in thermal capability |
| Heat load | Airflow and water-distribution insights |
| Fan speed or status | Fan power viewed alongside thermal performance |
| Current operating conditions | Trends that help isolate developing problems |
| Alarms after limits are reached | Earlier signs of performance moving off target |
This is different from simply inspecting a tower periodically. As we covered in Why Cooling Towers Need Continuous Condition Monitoring, Not Just Annual Inspections, inspections provide valuable information, but tower performance changes continuously with load, weather, equipment condition, and operating strategy.
What Happens When You Guess Instead of Measure?
Cooling tower troubleshooting can become expensive when a suspected cause turns into a capital project before the cause has actually been confirmed.
At one site discussed during our recent webinar, wind-driven plume recirculation was believed to be causing a cooling problem, and the facility was considering a multimillion-dollar solution. Sensor data showed recirculation was not the cause, helping the site avoid moving forward with the wrong project. At the Arizona food and beverage facility, the site had similarly been considering adding another cooling tower before the underlying performance issues were identified within its existing system.
Want to hear more of the real-world examples behind these cooling tower performance problems? The on-demand webinar, What Your Cooling Tower Really Costs You, takes a deeper look at how the issues were identified and what the data revealed.
.png?width=1200&height=675&name=Estimated%20Size_On%20Demand%20(website).png)
How Does Continuous Cooling Tower Performance Monitoring Work?
Continuous performance monitoring brings operating conditions together so maintenance and operations teams can understand how the tower is performing, not simply whether individual components are running.
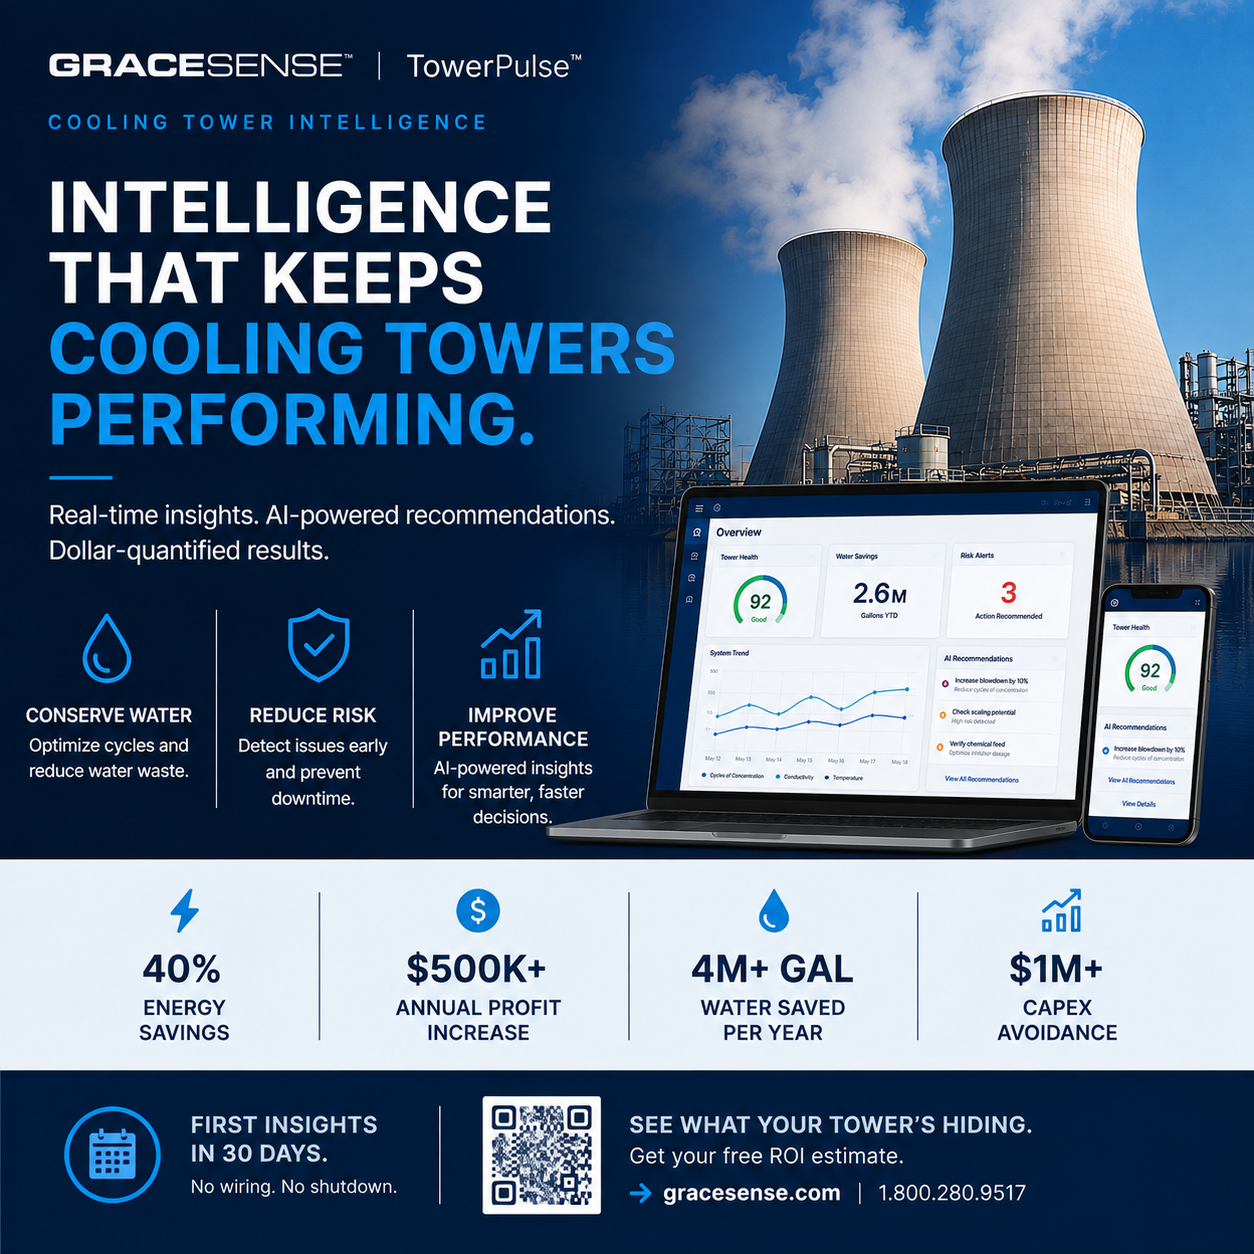
The GraceSense × TowerPulse solution combines GraceSense IIoT wireless sensing with TowerPulse Physics-Informed AI. Wireless sensors can capture temperature and flow, humidity and wet-bulb conditions, and fan speed and power. Existing instrumentation can also be incorporated rather than unnecessarily duplicating measurements.
TowerPulse analyzes the operating data to evaluate areas including capability, efficiency, maintenance, and water use. The platform can identify anomalies, quantify the impact of identified issues in dollars, kilowatt-hours, and gallons, and provide recommendations prioritized by impact.
GraceSense vibration monitoring can add another piece of the picture by monitoring motor and fan health while TowerPulse evaluates thermal performance. Together, the information can help distinguish mechanical conditions from cooling-performance problems. The platform recommends actions rather than controlling cooling tower equipment, leaving operating decisions with the facility team.
In Conclusion: Stop Guessing Where Your Cooling Capacity Went
When a cooling tower loses performance, the answer is not always obvious from water temperature, fan status, or a visual inspection. Degraded fill, restricted airflow, unstable controls, poor water distribution, VFD faults, belt slippage, and changes elsewhere in the cooling system can create similar symptoms. The challenge is determining which one is actually affecting your tower before investing time and money in the wrong fix.
For facilities where cooling directly affects production, reliability, energy consumption, or water use, that visibility can have a meaningful operational impact. This includes power generation, chemicals and refining, food and beverage, metals, pharmaceuticals, and campus or data center chiller plants, with applications ranging from factory-assembled evaporative towers to larger field-erected systems.
Continuous performance data gives maintenance and operations teams more evidence to understand why performance is changing and where to investigate first. GraceSense × TowerPulse combines wireless sensing with Physics-Informed AI to help identify performance losses, quantify their impact, and prioritize areas for further action. See what your cooling tower is costing you.

FAQs About Cooling Tower Efficiency
How Do You Calculate Cooling Tower Efficiency?
Cooling tower efficiency can be calculated as Range ÷ (Range + Approach) × 100. Range is the difference between hot-water and cold-water temperature, while approach is the difference between cold-water temperature and ambient wet-bulb temperature.
What Is a Good Cooling Tower Efficiency?
There is no single efficiency percentage that is appropriate for every cooling tower. Tower design, operating load, water flow, airflow, and ambient wet-bulb conditions all affect performance, so comparing actual operation against design conditions and trends over time provides important context.
Why Does My Cooling Tower Perform Worse in Summer?
Higher wet-bulb temperatures reduce the cooling potential available to an evaporative tower. If the tower has also lost thermal capability because of fouled fill, airflow restrictions, water-distribution problems, or other conditions, those limitations can become more apparent during hot summer conditions.
How Do I Know if My Cooling Tower Fill Needs Replacing?
Scale, fouling, visible deterioration, uneven water distribution, and declining thermal performance can all indicate that fill condition deserves investigation. Thermal performance data can help determine whether fill degradation is contributing to lost capacity, while physical inspection remains important when deciding whether replacement is necessary.
Can Vibration Monitoring Tell Me if My Cooling Tower Is Performing Well?
Not by itself. Vibration monitoring provides information about the mechanical health of motors, fans, bearings, and other rotating equipment, while thermal performance monitoring evaluates the tower's ability to reject heat. Using both can provide a more complete view of equipment condition and tower performance.
Does Cooling Tower Monitoring Control My Equipment?
No. The GraceSense × TowerPulse platform provides monitoring, analysis, and recommendations. It does not control cooling tower equipment. Operations and maintenance teams determine what actions to take based on the information provided.
Zero Harm. Zero Downtime.